 on
the Viewer toolbar is ON, the display shows deduct measurements
within Groups as voids so that each Group measurement is represented graphically
as a single item. By default, the Voids toggle button is OFF.
on
the Viewer toolbar is ON, the display shows deduct measurements
within Groups as voids so that each Group measurement is represented graphically
as a single item. By default, the Voids toggle button is OFF.Group measurements are a collection of individual measurements of the same type (Area, Count, Length, etc). Each Group will usually represent a particular class of measurement; for example, floor finish areas may be collected into Carpet, Ceramic and Laminate Group measurements. Groups may contain both Add and Deduct measurements and display a single value which is the aggregate of all the member measurements. Groups are initially created from selections on the Measurement grid and may be edited via the Groups Window.
Normally, all measurements (including Group members) are displayed on the graphics screen using their own styles providing easy identification and selection of any individual measurement. However, in certain cases this will not always provide the desired representation. Consider the example where the Gross Floor Area of a building is measured as an Add measurement then a second Deduct measurement is made around a stairwell or lift shaft. These measurements are then grouped together to provide the Floor Area nett of the stairwell. In this case it may be preferable to see the area displayed with a hole or ‘Void’ in place of the Deduct instead of two superimposed measurements. This alternative view is achieved by toggling the mode of the view to Voids mode
When the Voids toggle button  on
the Viewer toolbar is ON, the display shows deduct measurements
within Groups as voids so that each Group measurement is represented graphically
as a single item. By default, the Voids toggle button is OFF.
Create a measurement group (for more information on creating groups, see Group Measurement. For example, the following screenshot has one Add and 5 overlapping Deduct measurements.
Note: Only Groups which contain both Add and Deduct Area measurements will be displayed differently in Void mode. Groups of all Adds or all Deducts or Groups of non-Area types will continue to display as individual measurements
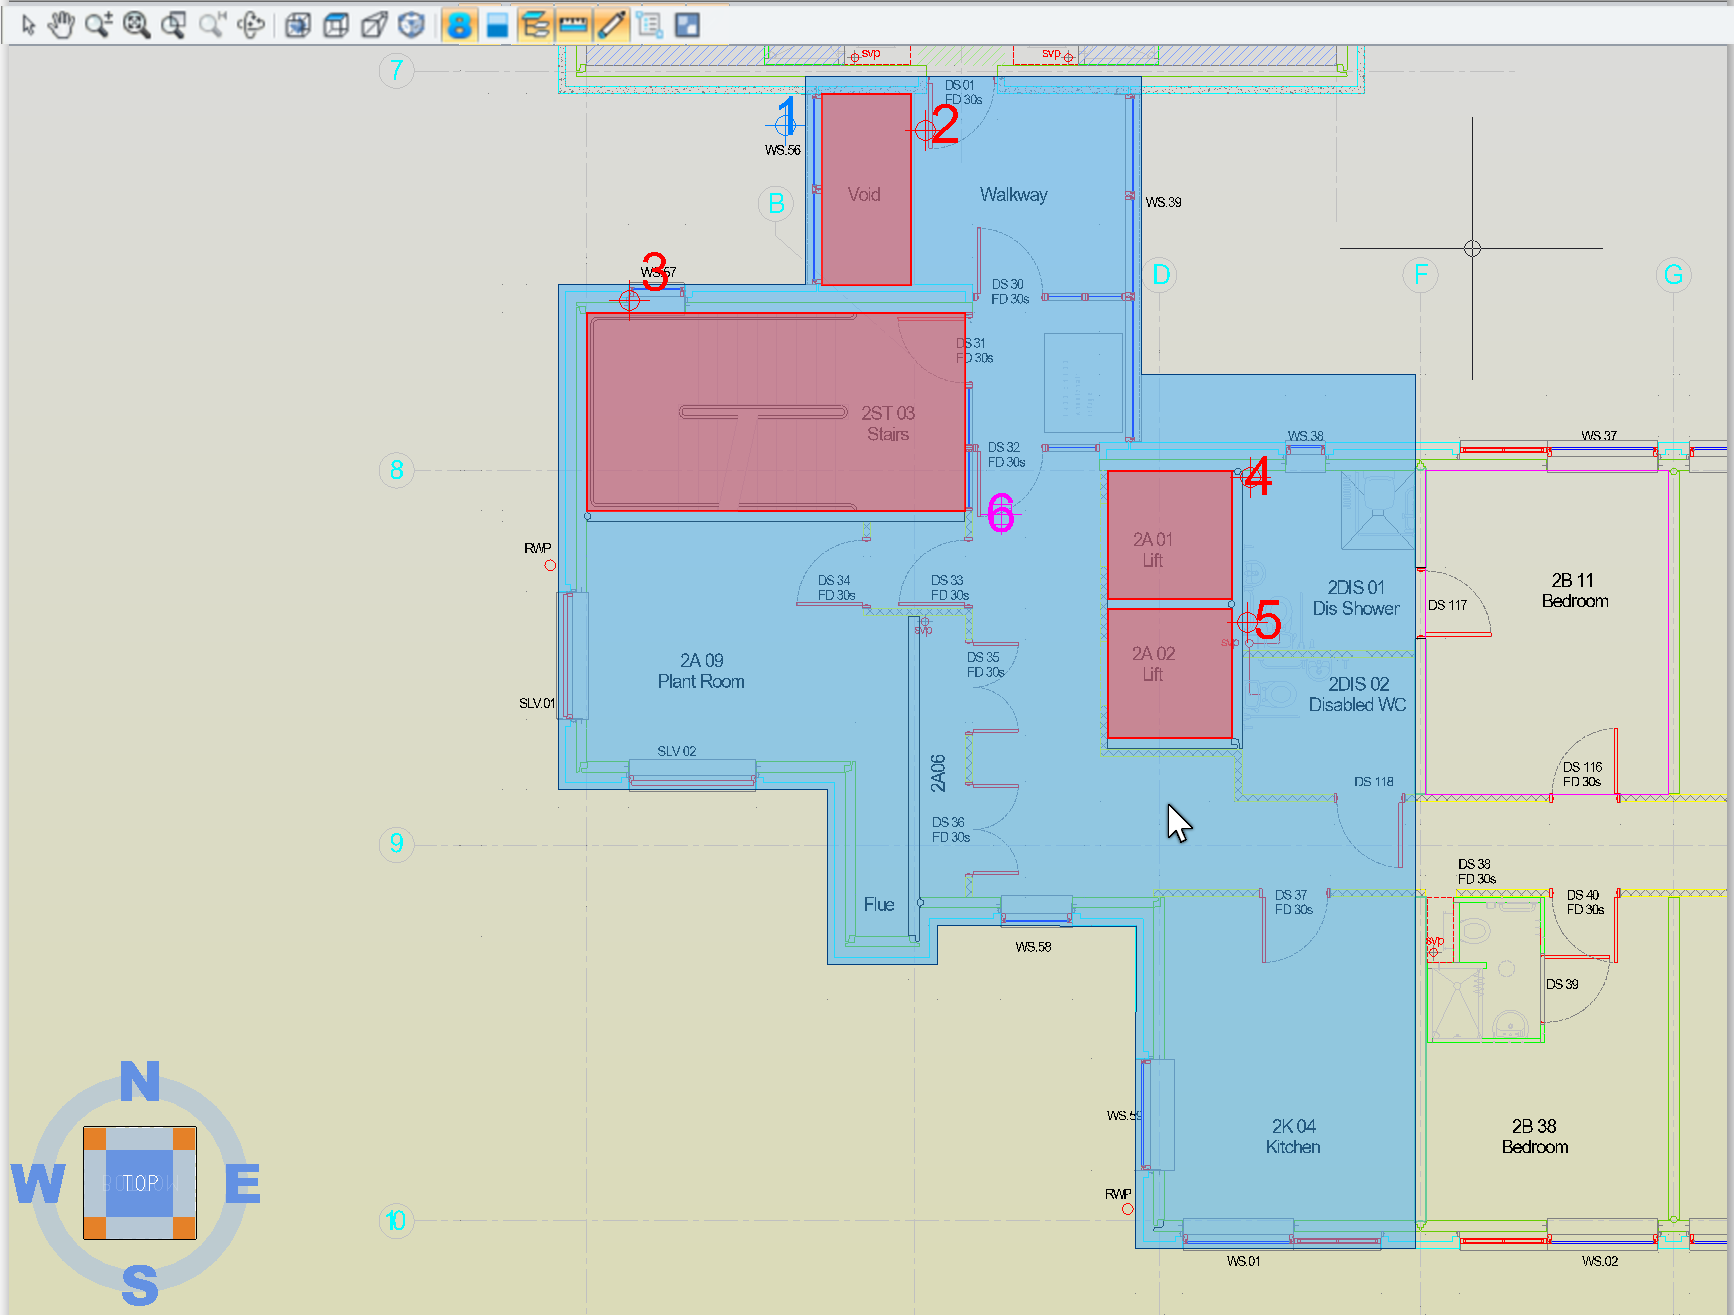
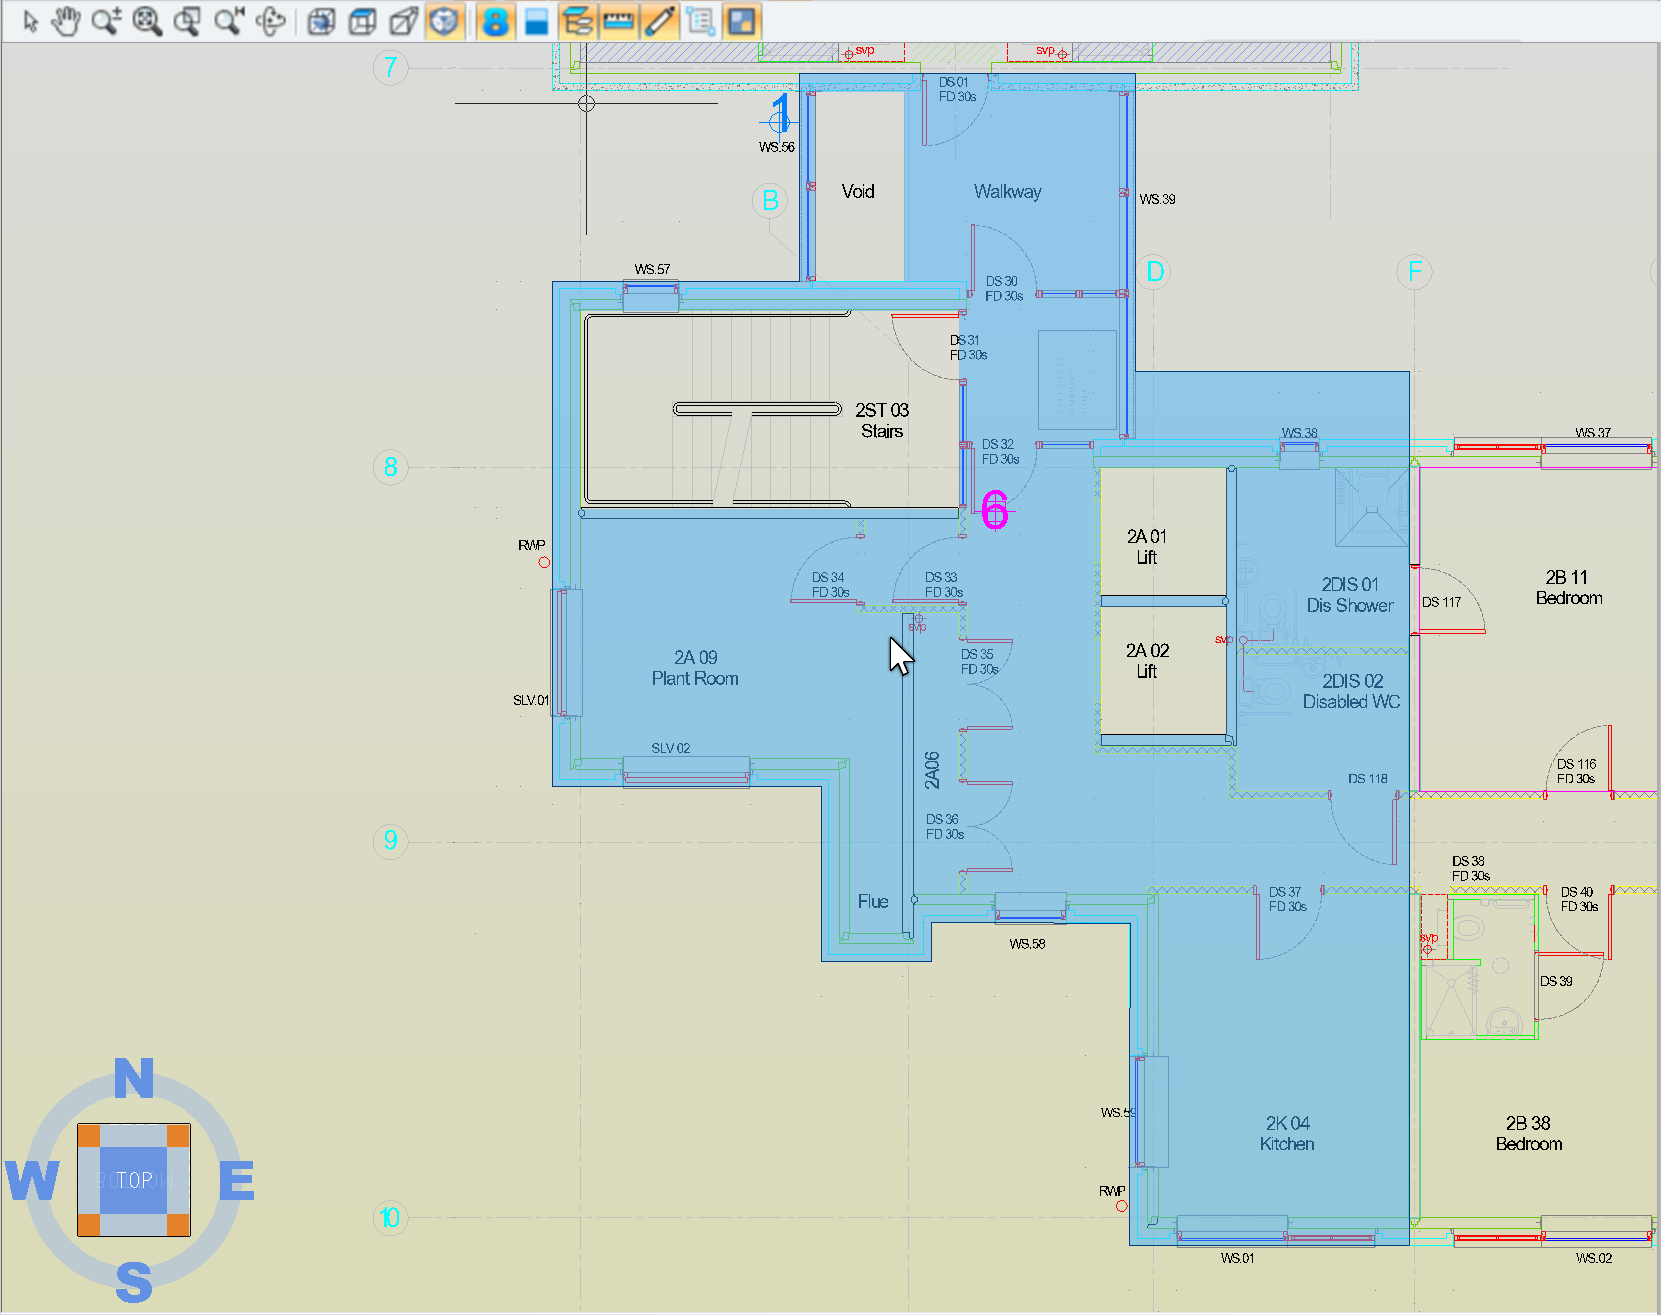
Click the Voids toggle button to turn ON. For example, measurements 2 to 5 are then voided as in the following screenshot. Group measurement 6 in the Measurements grid displays the net value after subtracting the Deduct measurements (voided areas).
If the position of any Deduct measurements in a Group do not fully align with the Add measurements which they void, then the invalid part will be shaded with a warning pattern. For example, in the following screenshot a single Deduct measurement (15) is grouped together with two Add measurements (11 and 12) but part of that Deduct does not overlap with either of the Adds. The overlapping parts are voided but the non-overlapping part is shown with the warning pattern. Note that the Group value still aggregates the 2 Adds and complete 1 Deduct values.
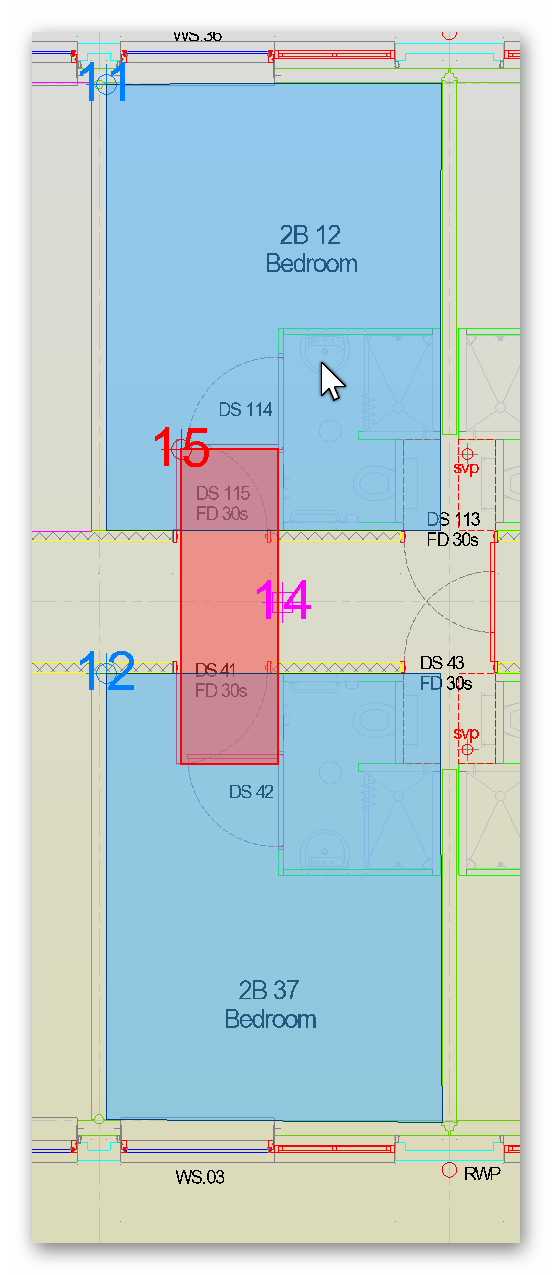
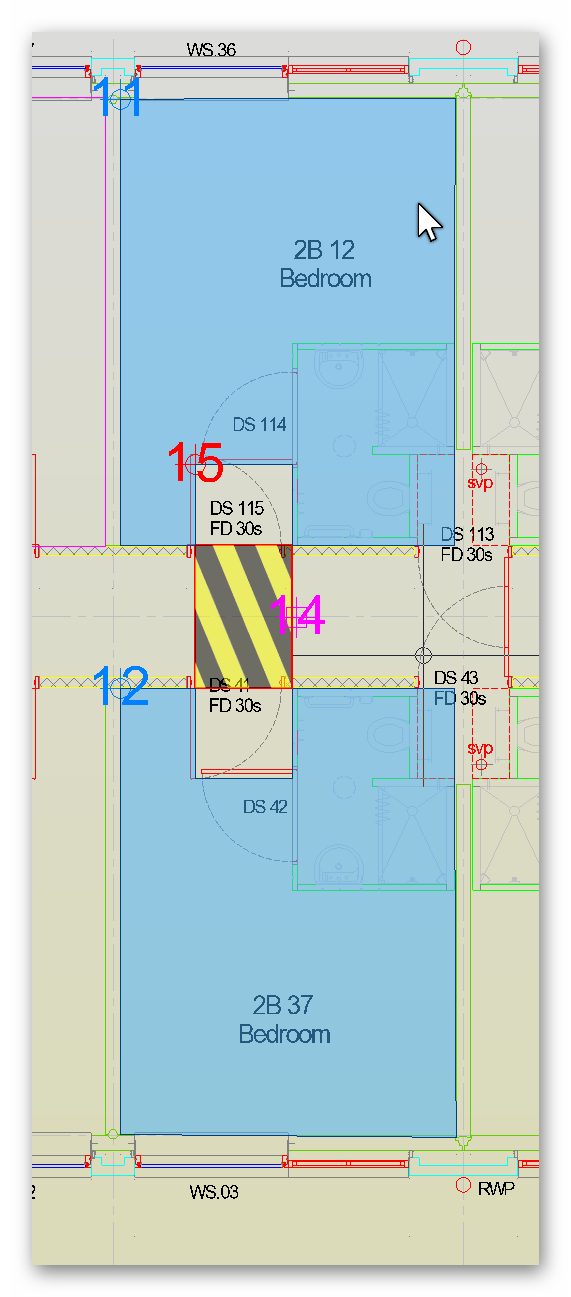
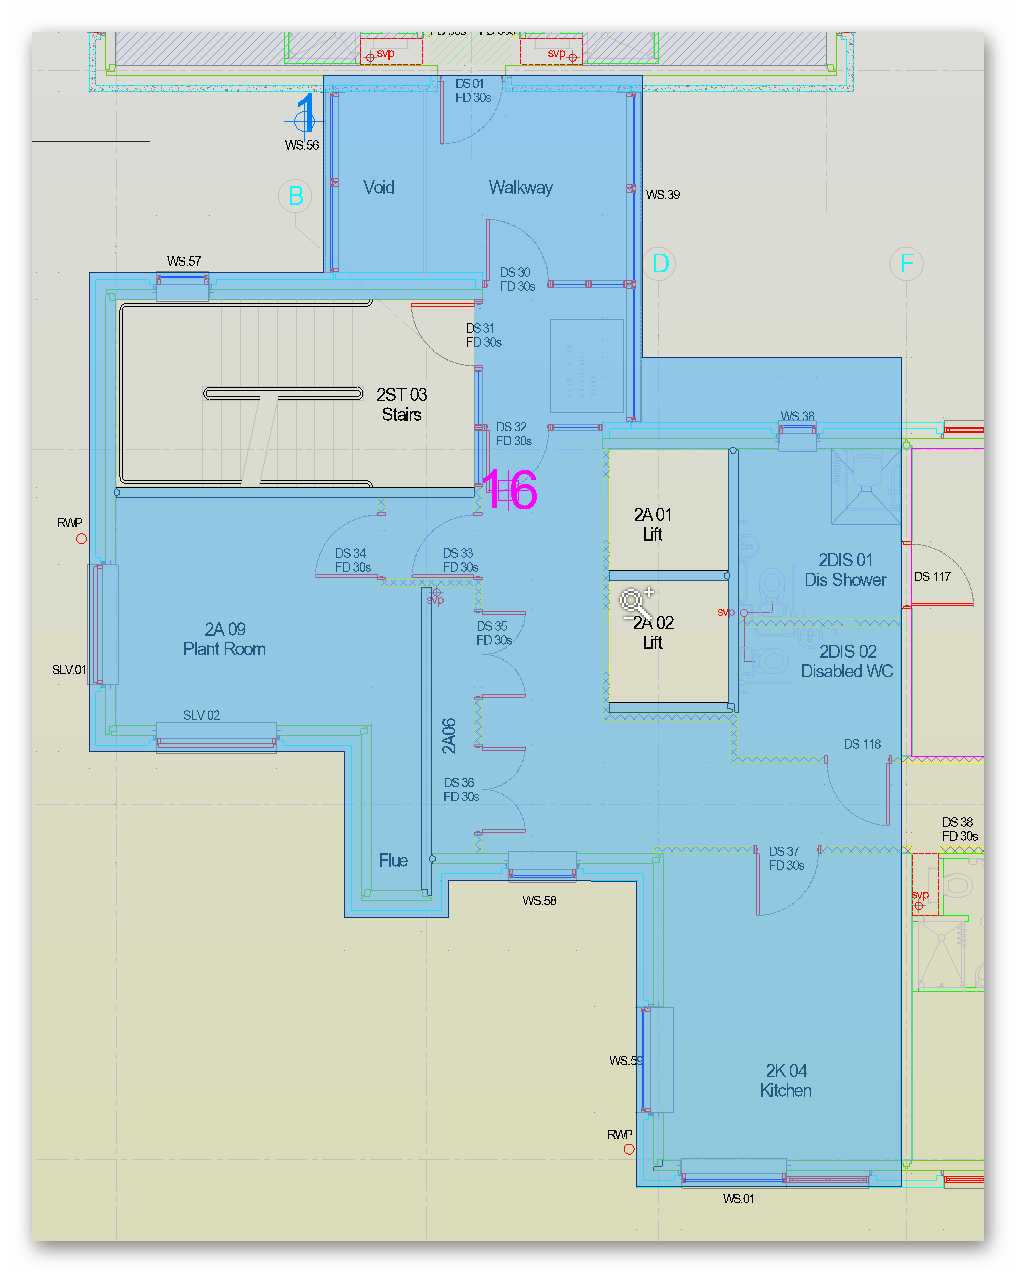
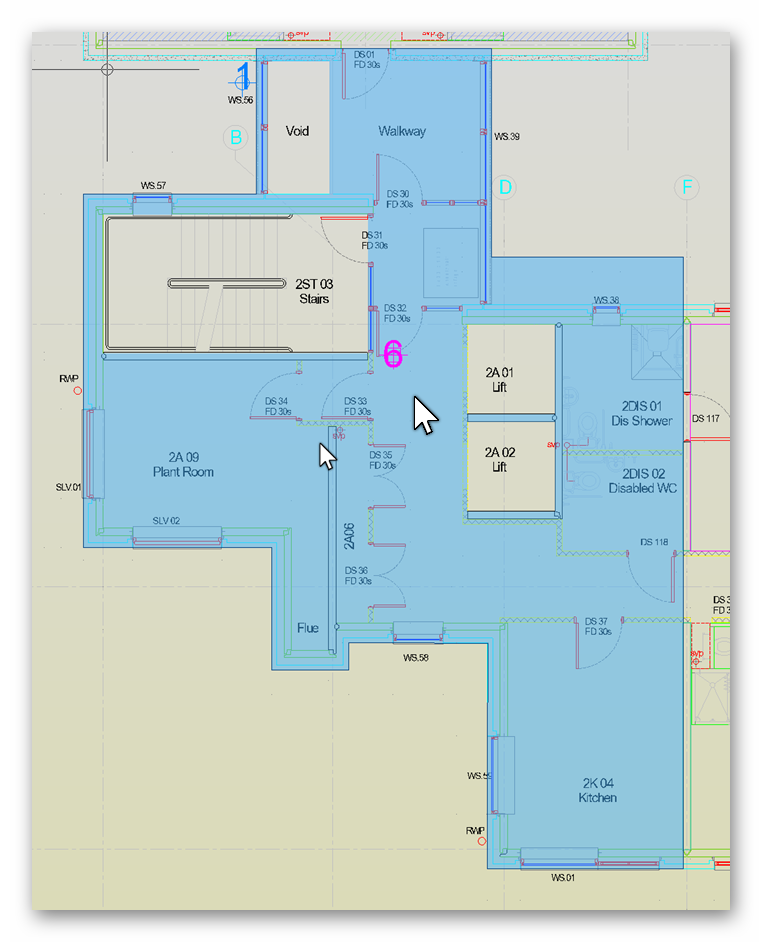
In some cases, measurements may appear in more than one Group. Obviously this could results in conflicts in appearance on the display for voided Groups. Therefore, in Void mode, the display of such items can be controlled by toggling off the visibility of entire Groups or individual Group members. In the original example, a new Group (16) has been created. This is similar to Group 6, but does not include Deduct meaurement 2 (ie it comprises only 1 and 3-5). It clearly is not logical to display both Group 6 and Group 16 at the same time, so in the screenshot below, Group 6 has been made invisible. The second screenshot reverses this with Group 6 visible and Group 16 invisible:
